An interactive visualization system to analyze and predict urban construction dynamics
GeoMonster is an analytic and visualization system for citizens and government agencies to understand, track, and predict the construction dynamics in an urban area. It was started as a hackathon project of 2015 Taipei Open Data Hackathon and surprisingly ended as a workshop paper in ACM SIGKDD Workshop on Urban Computing 2015. In the hackathon, Tzu-Chi, Ching-Yuan, and I were brainstorming about what is the urgent or serious issue that need to be solved by linking urban data and its geometric information with citizens in the city. Also, there are so many different types of urban data now opened by Taipei City Government (http://data.taipei). It turned out that construction issue is really bothering. Recalling from our experiences and surveys, we found some interesting phenomena.
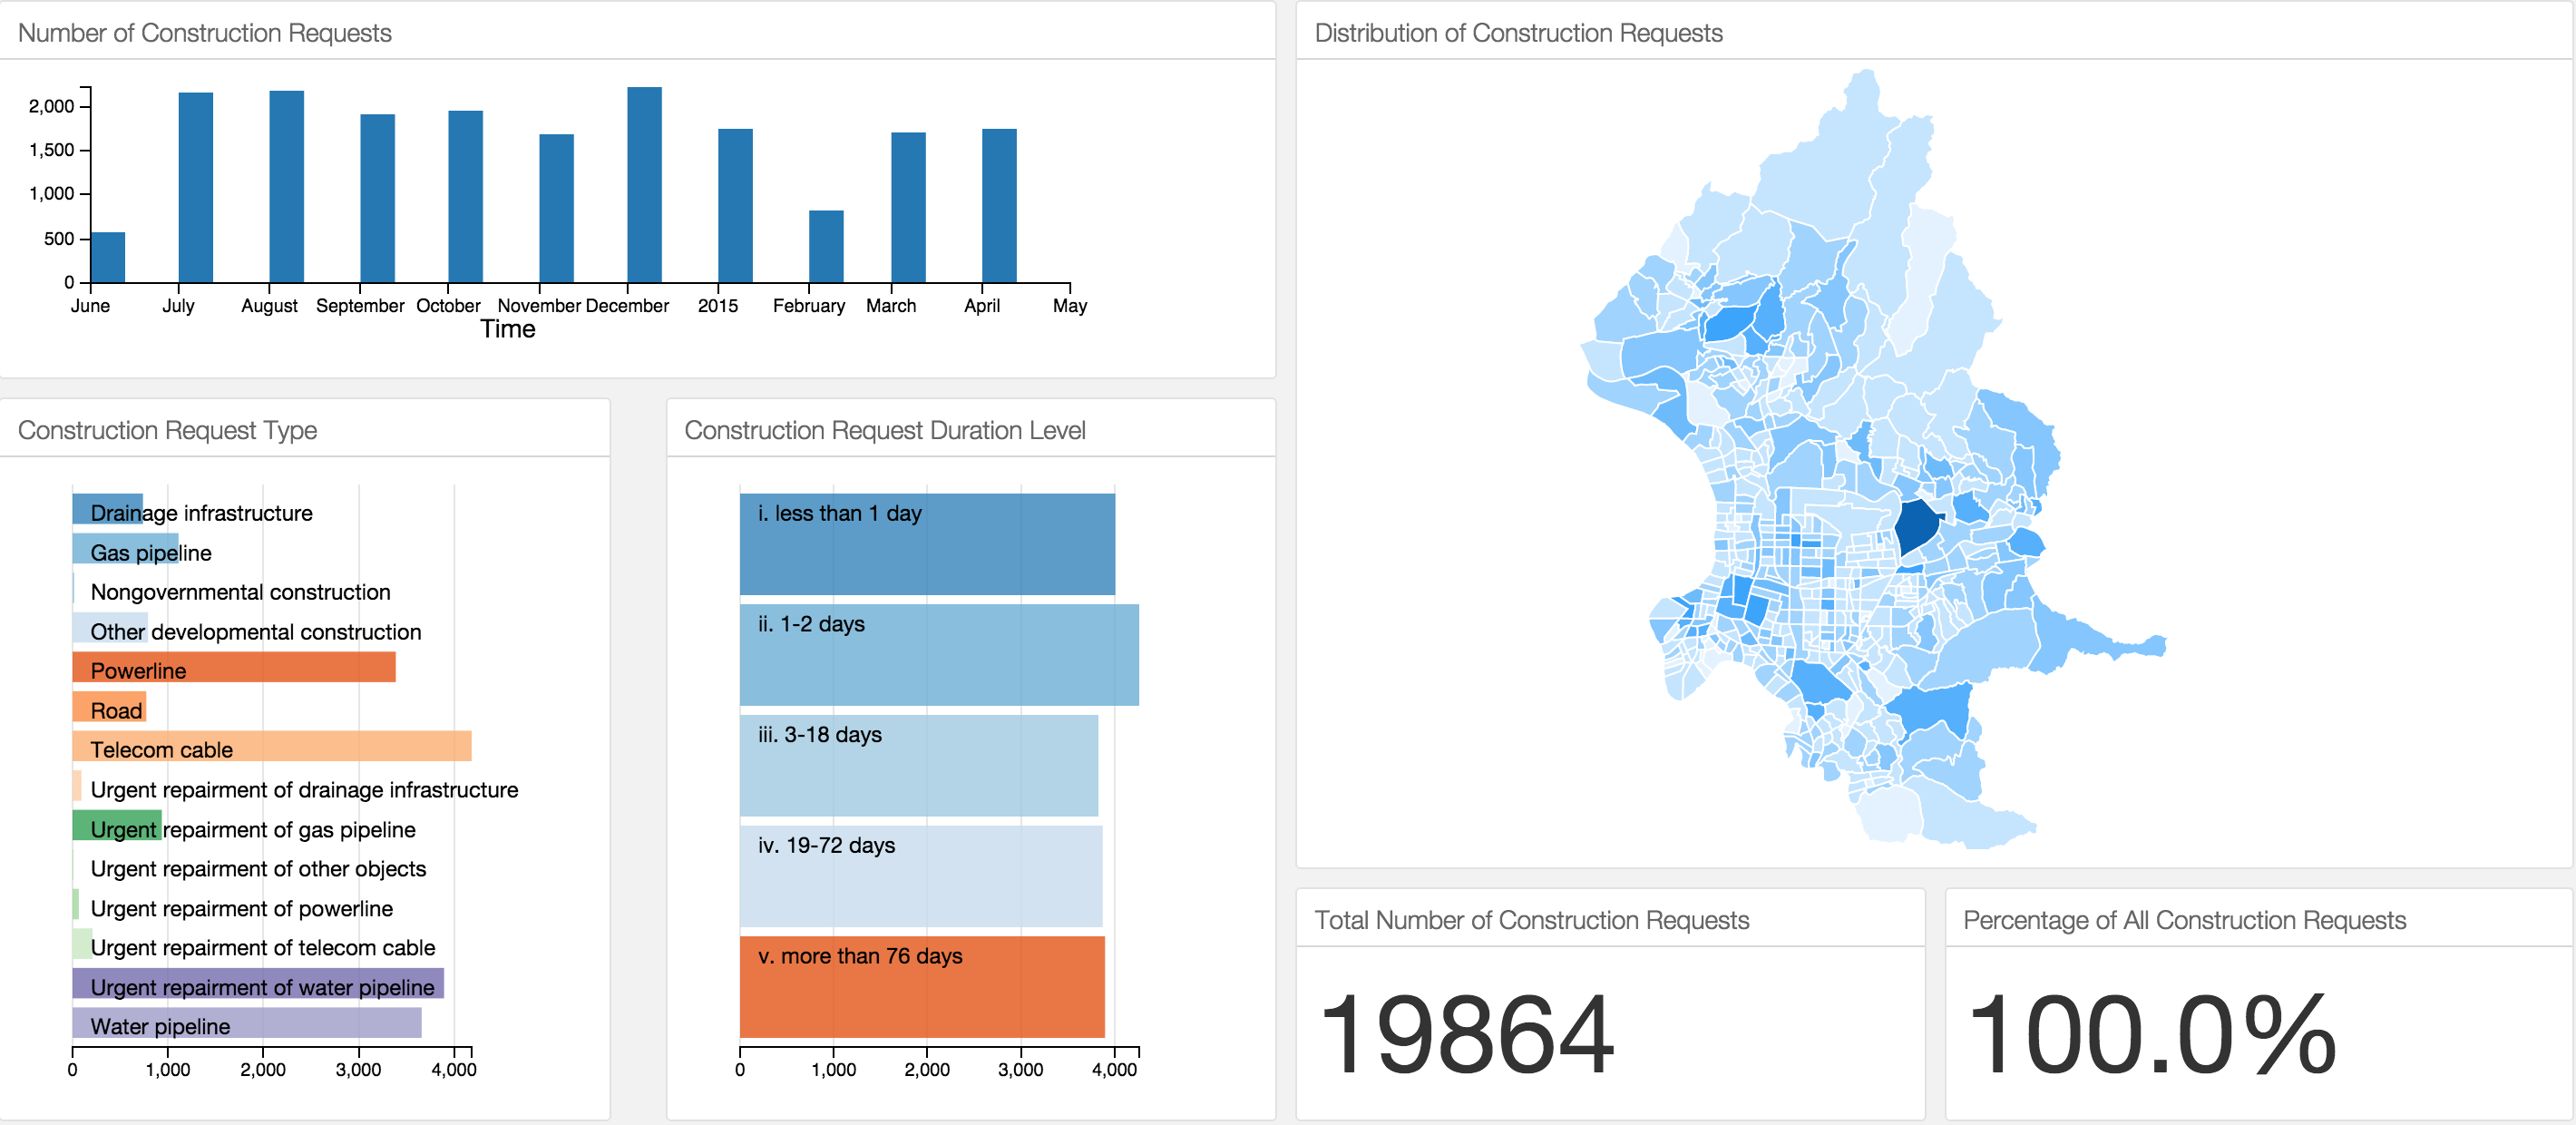
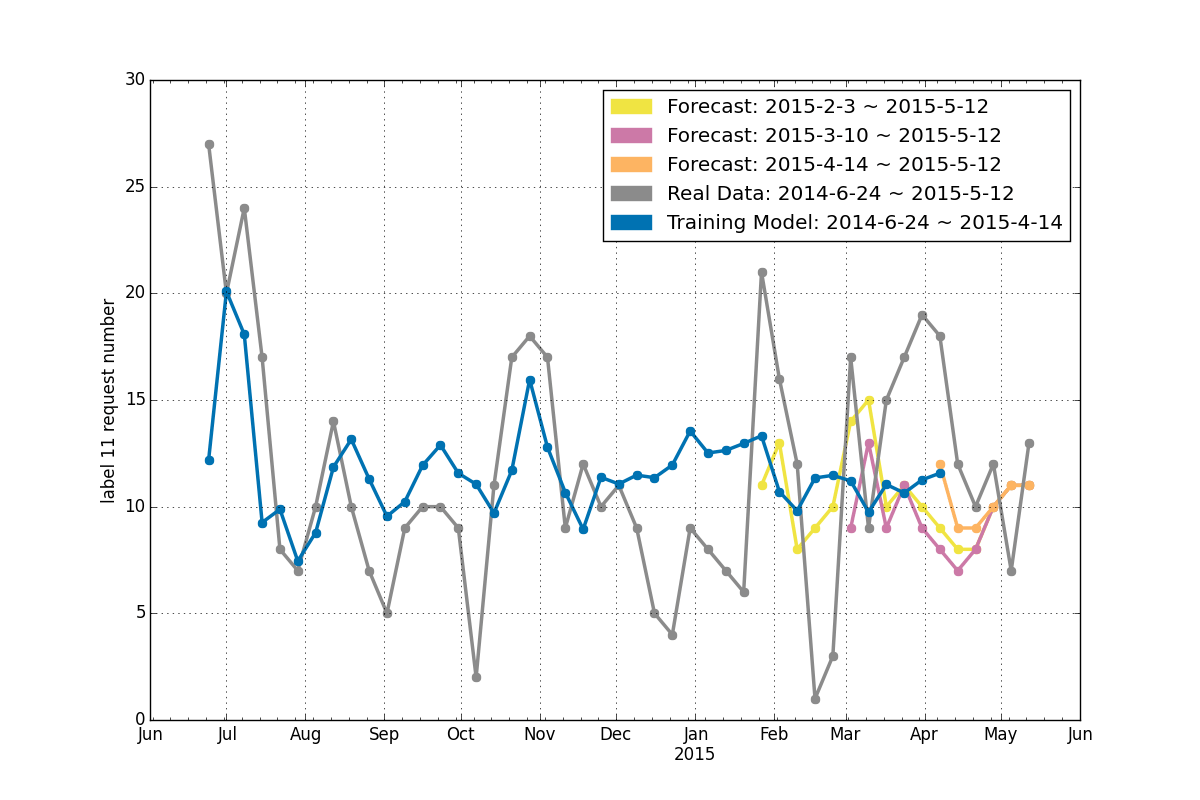
That says, the city construction request records can collectively depict urban contruction events through not only their geographical and temporal dynamics of contruction requests but also the corresponding labeled causes of construction events. These data can be analyzed by dynmically grouping regions that have the similar patterns of contruction requests. For example, we might be able to identify some regions that both the powerline and water pipeline related constructions play the dominant cause of construction requests. The analysis might also help to unveil the underlying problems of infrastructures or services. For example, the relatively high frquency of reporting in water-pipe burst in a certain region might hint aging or strctural weakness of the water pipeline in that area. The prolonged durations of contruction might indicate inefficient constructions. In addition to the visual presentation and analytics, the urban contruction request data also offer some potentials to be used to build a predictive model that estimates the future construction requests of certain types in any urban area of interest.
T.-C. Yen, T.-Y. Lin, C.-Y. Yeh, H.-P. Hsieh, and C.-T. Li, “An Interactive Visualization System to Analyze and Predict Urban Construction Dynamics”, ACM SIGKDD International Workshop on Urban Computing (UrbComp’ 15), in conjunction with KDD 2015, Sydney, Australia, Aug. 10, 2015.